

KEY TAKEAWAYS
1. Colorado’s property crime rate of 2,783 per 100,000 is the highest in the nation, while its per capita income of $77,959 ranks 8th.
2. Colorado leads all seven of its bordering states in both violent and property crime rates, despite also leading them in per capita income, with the widest gap against Utah, where property crime runs 1,155 incidents per 100K lower.
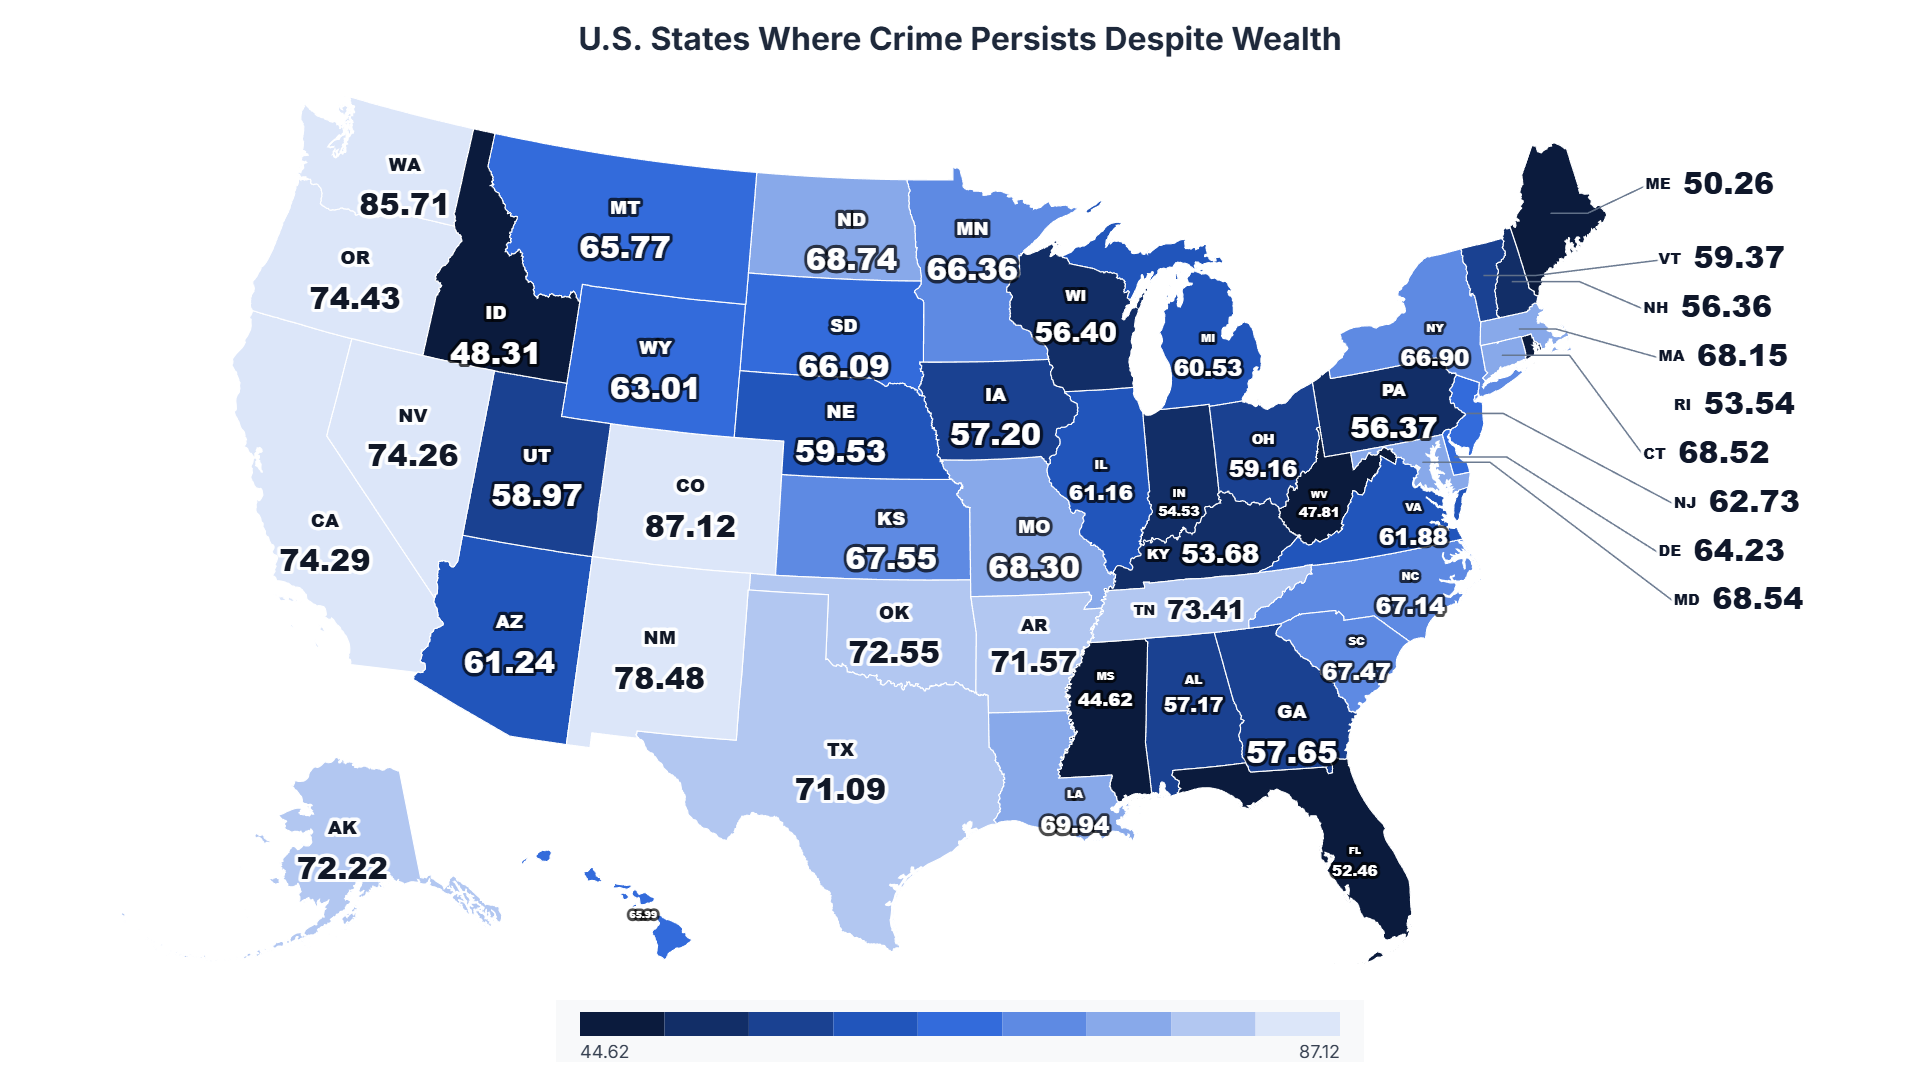
3. Colorado’s High Income, High Crime Index score of 87.12 out of 100 is the highest in America, 42.50 points above last-place Mississippi and 30.76 points above economic twin New Hampshire, which earns just $16.75 less per capita annually.
Colorado residents earn among the highest incomes in the country, yet face more property crime than any other state in America. A resident of New Hampshire, earning virtually the same paycheck, is about one-third as likely to experience property crime and nearly 4.7 times less likely to encounter violent crime.
The study conducted by Simmrin Law Group, a Los Angeles-based criminal defense firm, examined FBI crime data (2021–2025) and U.S. Census Bureau-American Community Survey data across all 50 U.S. states to identify where economic prosperity fails to translate into public safety.
Colorado State Profile
| Population (2021–2025 Avg.) | 5,900,150 |
|---|---|
| Avg. Per Capita Income (2021–2024) | $77,959 |
| National Income Rank | 8th |
| Avg. Annual Violent Crimes | 48,350 |
| Avg. Annual Property Crimes | 164,196 |
| Violent Crime Rate (per 100K) | 819 |
| Property Crime Rate (per 100K) | 2,783 |
| National Violent Crime Rank | 7th highest |
| National Property Crime Rank | 1st highest |
| High Income, High Crime Index | 87.12 |
| National HIHC Rank | 1st of 50 |
Top 10 High Income, High Crime States Nationally
| Rank | State | Avg. Per Capita Income | Violent Crime Rate(per 100K) | Property Crime Rate(per 100K) | HIHC Index |
|---|---|---|---|---|---|
| 1 | Colorado | $77,959 | 819 | 2,783 | 87.12 |
| 2 | Washington | $79,068 | 769 | 2,678 | 85.71 |
| 3 | New Mexico | $54,419 | 1,140 | 2,521 | 78.48 |
| 4 | Oregon | $66,153 | 645 | 2,539 | 74.43 |
| 5 | California | $80,440 | 628 | 1,666 | 74.29 |
| 6 | Nevada | $65,065 | 787 | 2,244 | 74.26 |
| 7 | Tennessee | $61,701 | 880 | 2,134 | 73.41 |
| 8 | Oklahoma | $59,265 | 880 | 2,191 | 72.55 |
| 9 | Alaska | $70,899 | 835 | 1,531 | 72.22 |
| 10 | Arkansas | $55,732 | 968 | 2,092 | 71.57 |
Colorado leads second-place Washington by 1.41 index points and fifth-place California by 12.83 points. Two of Colorado’s bordering states, New Mexico (#3) and Oklahoma (#8), also appear, but both earn $18,000 to $23,000 less per capita.
Colorado vs. Bordering States
| State | Avg. Per Capita Income | Violent Crime Rate(per 100K) | Property Crime Rate(per 100K) | HIHC Index | National Rank | Gap to Colorado(Index Pts) |
|---|---|---|---|---|---|---|
| Colorado | $77,959 | 819 | 2,783 | 87.12 | 1st | — |
| New Mexico | $54,419 | 1,140 | 2,521 | 78.48 | 3rd | -8.64 |
| Oklahoma | $59,265 | 880 | 2,191 | 72.55 | 8th | -14.57 |
| Kansas | $62,613 | 678 | 1,916 | 67.55 | 18th | -19.57 |
| Arizona | $61,266 | 555 | 1,600 | 61.24 | 30th | -25.88 |
| Wyoming | $79,686 | 334 | 1,174 | 63.01 | 27th | -24.11 |
| Nebraska | $68,560 | 347 | 1,457 | 59.53 | 33rd | -27.59 |
| Utah | $62,743 | 401 | 1,628 | 58.97 | 36th | -28.15 |
Colorado outscores every neighboring state on the index by between 8.64 and 28.15 points.
Colorado vs. the Bottom 10 States (Lowest HIHC Index)
| Rank | State | Avg. Per Capita Income | Violent Crime Rate(per 100K) | Property Crime Rate(per 100K) | HIHC Index | Gap to Colorado(Index Pts) |
|---|---|---|---|---|---|---|
| 1 | Colorado | $77,959 | 819 | 2,783 | 87.12 | — |
| 41 | Pennsylvania | $66,955 | 336 | 1,233 | 56.37 | -30.75 |
| 42 | New Hampshire | $77,943 | 176 | 929 | 56.36 | -30.76 |
| 43 | Indiana | $60,377 | 428 | 1,218 | 54.53 | -32.59 |
| 44 | Kentucky | $54,623 | 445 | 1,444 | 53.68 | -33.44 |
| 45 | Rhode Island | $66,491 | 274 | 1,099 | 53.54 | -33.58 |
| 46 | Florida | $67,777 | 285 | 871 | 52.46 | -34.66 |
| 47 | Maine | $63,845 | 200 | 1,080 | 50.26 | -36.86 |
| 48 | Idaho | $58,540 | 362 | 803 | 48.31 | -38.81 |
| 49 | West Virginia | $51,844 | 404 | 1,067 | 47.81 | -39.31 |
| 50 | Mississippi | $48,940 | 339 | 1,054 | 44.62 | -42.50 |
Colorado’s score of 87.12 nearly doubles last-place Mississippi’s 44.62. New Hampshire, earning just $16.75 less per capita, reports 78% less violent crime and 67% less property crime.
Methodology
This analysis extracted annual crime counts, income figures, and population estimates for all 50 U.S. states from federal data repositories, covering FBI crime statistics (2021–2025) and the U.S. Census Bureau – American Community Survey. Raw crime counts were converted to rates per 100,000 residents to enable cross-state comparison. Five-year averages were calculated for crime data and four-year averages for income data to smooth annual fluctuations. Normalized indices were developed on a 0–50 scale for income and 0–25 scale for each crime rate to enable cross-metric analysis. “High Income, High Crime” states were classified as those ranking in the top 50% for income while maintaining violent or property crime rates above national medians.
Data Sources
Crime Statistics: FBI Crime Data Explorer — https://cde.ucr.cjis.gov/LATEST/webapp/#/downloads
Income Data: U.S. Census Bureau – American Community Survey, Table B19301: Per Capita Income in the Past 12 Months — https://data.census.gov
Research Datasheet: https://docs.google.com/spreadsheets/d/1LnRvVhWbbBkud7mtq27PscEYLuEeL-R1ffkyXNSbGlo
Study by: https://www.simmrinlawgroup.com
About Simmrin Law Group
Simmrin Law Group is a Los Angeles-based criminal defense firm with over 15 years of experience representing clients throughout California. The firm handles cases involving violent crimes, property crimes, drug offenses, and white-collar criminal matters, combining public defense experience with strong relationships in the legal community.