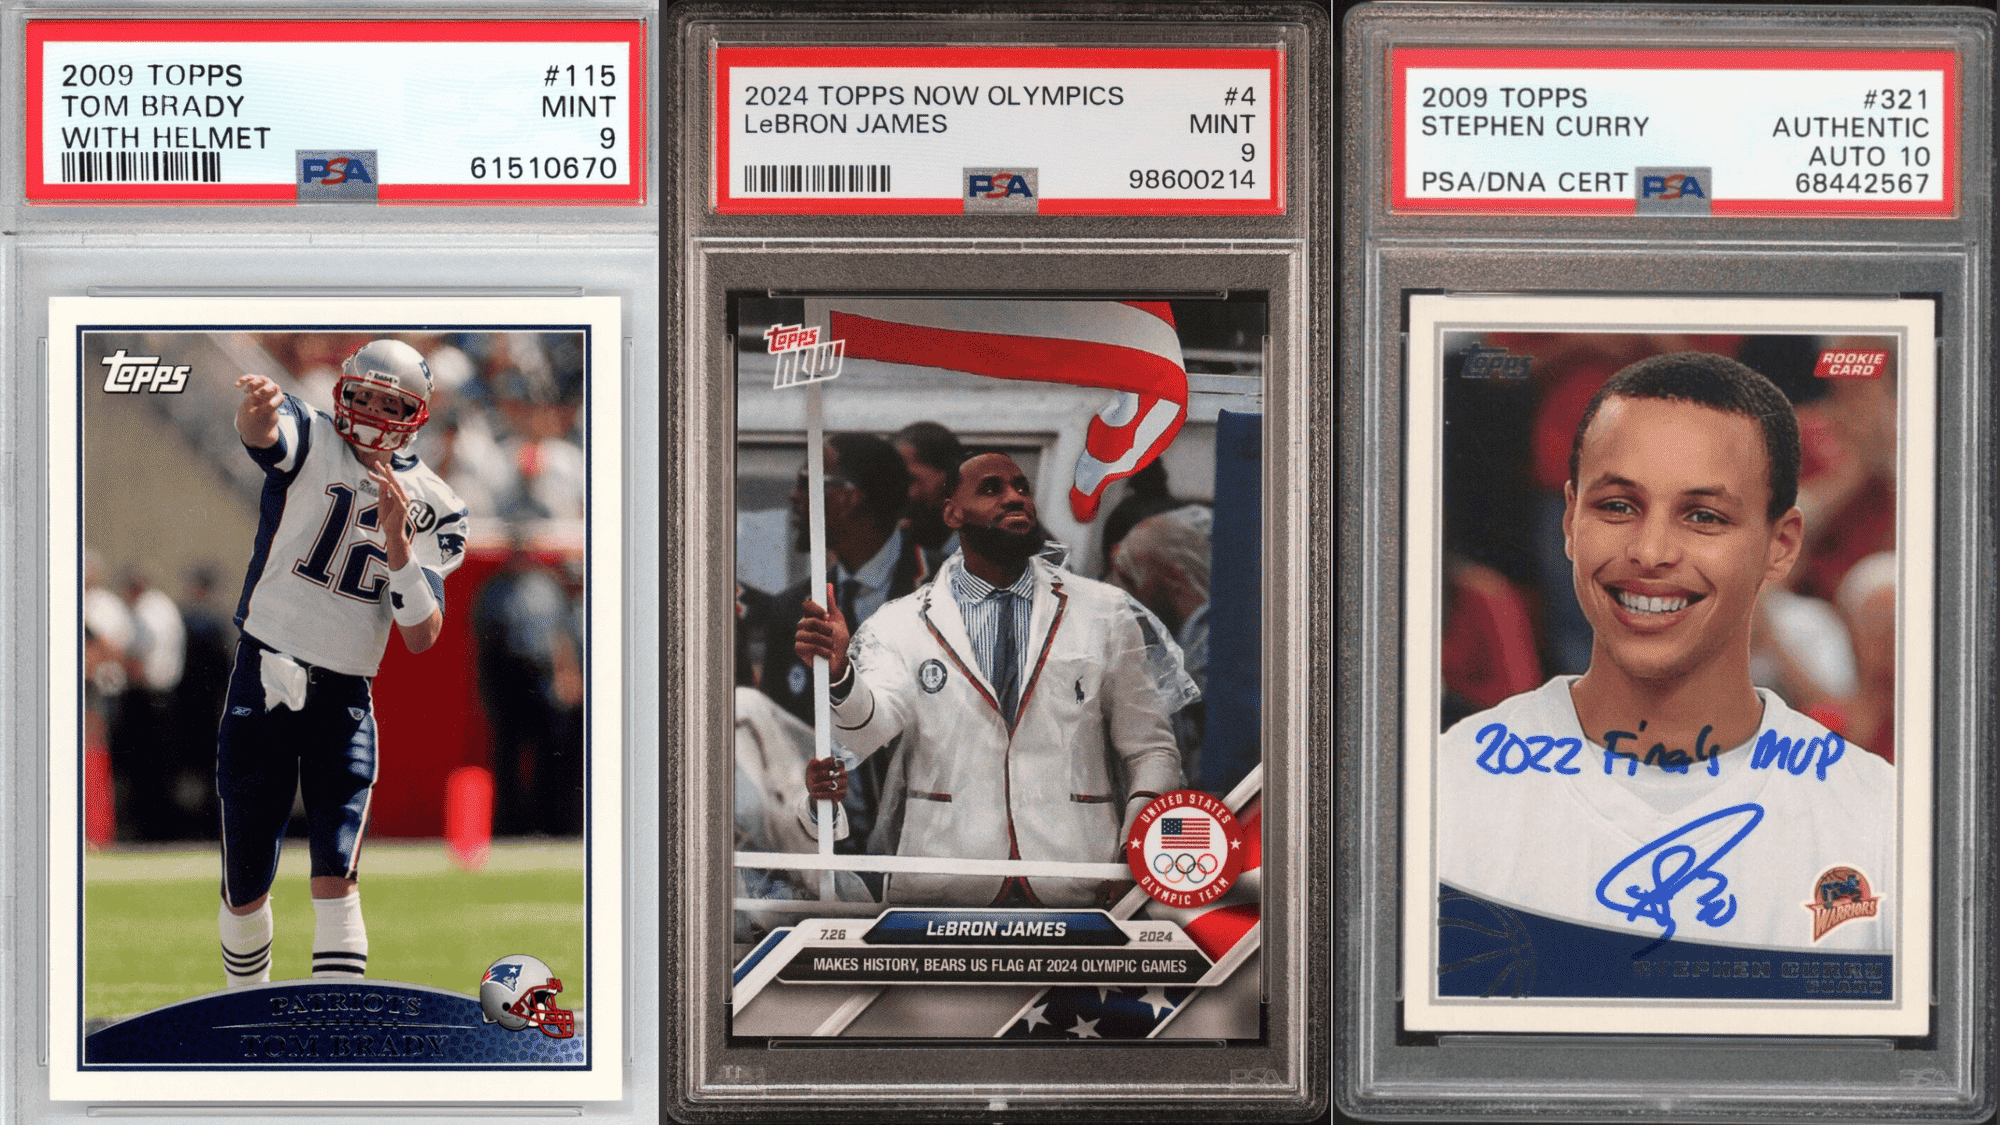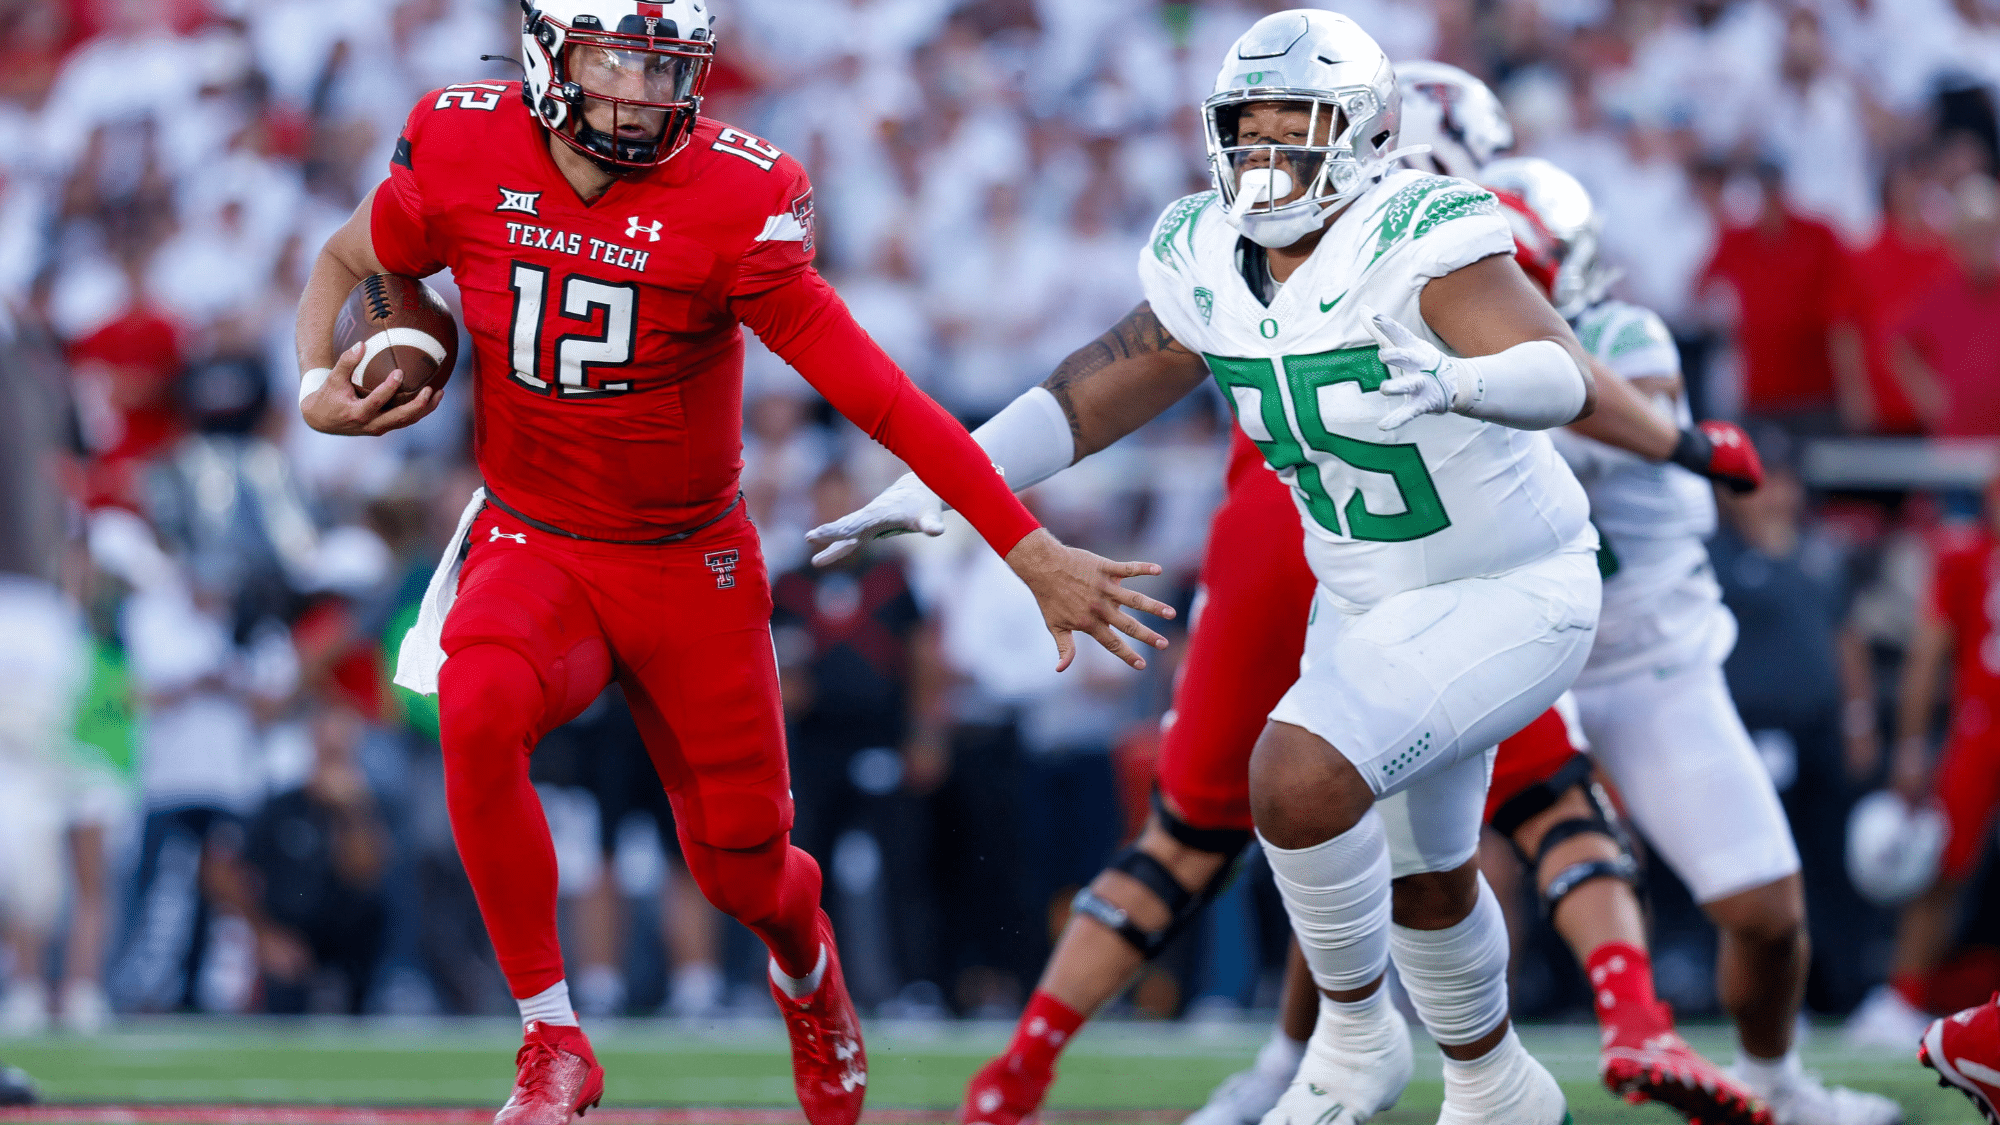


Sports analytics has become part of nearly every professional game, front office decision, and conversation among fans.
Coaches use it to adjust strategy mid-game, front offices use it to negotiate contracts, and broadcasters use it to explain what viewers are watching in real time.
What started as a niche approach in baseball has spread across nearly every major sport, changing how teams recruit players, prevent injuries, and price tickets.
Ahead, you will find what sports analytics means, the types that exist, and how teams collect and apply the data. It also covers real examples from baseball, basketball, football, and soccer, along with what a sports analytics degree looks like if you want to build a career in the field
What Is Sports Analytics?
Sports analytics is the practice of collecting and studying sports data to help teams, coaches, and players make better decisions.
In simple terms, it means looking at the actual numbers behind a game rather than relying on a hunch about what worked.
The field blends three areas together: sports knowledge, math, and computer science.
For example, a football coach might look at a player’s pass completion rate under pressure and adjust the game plan based on that number, rather than relying on instinct alone.
On-Field Analytics vs. Off-Field Analytics
Not all sports analytics work the same way. Some of it focuses on what happens during a game, while other parts focus on running the business side of a team. Here is how the two compare.
| Category | Focus Area | Examples |
|---|---|---|
| On Field Analytics | Player performance and game tactics | Pass completion rate, shot accuracy, injury tracking |
| Off Field Analytics | Business and fan side of the sport | Ticket pricing, sponsorship deals, fan engagement data |
Both sides work together behind every win. On-field data shapes performance, while off-field data keeps the business and fan experience running smoothly.
Why Sports Analytics Is No Longer Optional
Sports analytics has moved from a nice-to-have tool to a key part of how teams operate. Here is why it carries so much weight today.
From Gut Feeling to Data-Backed Decisions: Before analytics became common, most coaching and scouting decisions were based on experience and instinct.
Scouts trusted what they saw with their own eyes. Today, that same experience is paired with hard numbers, which makes decisions more consistent and easier to defend.
The Numbers Behind the Growth: The sports analytics industry is projected to pass $31 billion by 2034, according to Built In. Job growth in the field is also strong, with different roles projected to grow between 15 and 31 percent over the next decade.
Types of Sports Analytics Explained
Sports analytics is not one single method. It breaks down into three distinct types, each answering a different question about the game.
1. Descriptive Analytics
This type looks at what already happened during a game or season.
It answers basic questions such as how many shots a player took, how far a team moved the ball, or how a match played out from start to finish.
It gives coaches a clear record to work from before any deeper analysis begins.
2. Predictive Analytics
This type looks ahead rather than back.
It uses past data to estimate what is likely to happen next, such as injury risk, fatigue levels, or the outcome of an upcoming game.
Teams use these estimates to plan training loads and lineup choices well before a situation actually becomes a problem on the field.
3. Prescriptive Analytics
This type goes one step further by suggesting what a team should actually do in a given situation.
Examples include resting a player, changing a formation, or adjusting the training schedule for the coming week.
It takes the numbers from the other two types and turns them into a clear, practical next step.
How Teams Actually Collect and Use the Data

Behind every stat on a scoreboard is a process most fans never see. Here is how teams actually gather and apply that data day to day.
Where the Data Comes From
- Wearable devices and heart rate monitors that track physical output
- GPS and optical tracking systems that follow player movement
- Video review software that breaks down plays frame by frame
Turning Raw Numbers Into a Game Plan
Once data is collected, teams follow a simple process.
They collect the information, clean up any errors, analyze the patterns, and apply what they learn to training or strategy.
Common Tools and Software: tracking systems that gather data, stats platforms that organize it, and visualization software that turns it into charts coaches can read quickly.
Real Uses of Sports Analytics You Might Not Know About
Sports analytics shows up in far more places than the scoreboard. Here are some everyday decisions that quietly shape a team’s operations.
Player Recruitment and Contract Decisions: Teams use performance data to spot talent that traditional scouting might miss, and rely on the same to support salary offers and contract length.
Injury Prevention and Player Health: Wearable data helps trainers spot fatigue and strain before injuries occur, the same pattern behind some of the most serious soccer injuries over the years, allowing early adjustments.
In-Game Strategy and Play Calling: Coaches use live data to adjust plays, defensive sets, and substitutions in real time.
Ticket Pricing and Business Decisions: Teams study demand patterns to set ticket prices that match how badly fans want to see a specific game.
From the locker room to the ticket booth, these decisions rarely make headlines, but they shape nearly every part of how a team runs.
How Different Sports Use Analytics
Every sport has its own numbers that matter most. Here is a closer look at what different teams track, how they apply it, and why the approach shifts from one game to the next.
Baseball

Baseball teams focus heavily on metrics like on-base percentage and exit velocity, ultimately coming down to the ongoing back-and-forth between hitter and pitcher.
This data drives player value assessments and lineup decisions, helping coaches build a batting order that maximizes scoring chances over a full season.
Basketball

Basketball relies on shot selection data and detailed player tracking.
Teams use these numbers to shape offensive strategy, identify favorable matchups, and decide which shots are worth taking during close games.
Football

Football teams track play prediction models and player workload data closely. This information supports game planning against specific opponents and plays a major role in preventing injuries tied to overuse or fatigue.
Soccer

Soccer clubs study passing networks and detailed match data to understand team chemistry.
Coaches use this to shape tactics, while scouts use the same data to identify promising players for recruitment.
Hockey

Hockey teams pay close attention to shot quality and ice time distribution. Coaches use this data to build effective line combinations and manage player rotation across long, physically demanding seasons.
How Fans Use Sports Analytics Every Day
Sports analytics is not just for teams and coaches. Fans lean on the same data in ways that shape how they watch, play, and bet on the game.
- Fantasy Sports and Draft Decisions: Fans use player stats and projections to build fantasy rosters and decide who to pick each week.
- Betting Lines and Win Probability: Sportsbooks set betting lines using the same type of data models that teams use internally.
- Second Screen Stats During Live Games: Many fans watch games with a stats app open, checking win probability or player numbers as the action happens.
- Understanding Player Ratings and Broadcast Graphics: Broadcast graphics showing player ratings or efficiency scores come directly from sports analytics models.
In one form or another, most fans are already reading the same numbers teams use, just from the other side of the screen.
Real Stories of Sports Analytics Changing the Game
Numbers on a spreadsheet can be hard to picture. These real examples show exactly what sports analytics looks like when it plays out on the field.
The Oakland Athletics and the Moneyball Story

IMAGE BY: Getty Images
The Oakland Athletics used analytics to build a competitive team on a small budget by targeting undervalued players, a story later told in the book and movie Moneyball.
- Built a playoff team on one of MLB’s lowest payrolls
- Prioritized on base percentage over instinct-based scouting
- Set an AL record with a twenty-game win streak
The Three-Point Shift in the NBA

IMAGE BY: Getty Images
NBA teams increased three-point attempts after analytics showed the shot was more valuable per possession than long two-point shots.
- Three-point attempts have doubled since the early 2010s
- Threes now carry more value per possession than long twos
- Offenses are built around spacing for open threes
Data-Driven Recruiting in the Premier League

IMAGE BY: Getty Images
Premier League clubs now use data models to scout international talent before players ever set foot in England.
- Clubs track thousands of data points per match
- Models help spot undervalued players early
- Data pairs with scouting, not replaces it
Sports Analytics as a Career
For anyone drawn to sports and numbers, this field offers a real career path. Here is what the roles, skills, and pay actually look like.
- Common Job Titles: Common roles include data analyst, performance analyst, scout, and sports data scientist.
- Skills You Actually Need: Most roles require statistics knowledge, one coding language such as Python or R, sport-specific knowledge, and the ability to explain findings clearly to coaches and executives.
- Job Pay: Entry-level roles typically pay $40,000 to $60,000 a year, while mid- to senior-level roles range from $85,000 to $125,000. The broader job category is expected to grow extensively through 2033.
The pay and titles will keep shifting as the field grows, but the demand for people who can read the numbers isn’t slowing down anytime soon.
Sports Analytics Degree Options Explained
A sports analytics degree is not always its own major. Most programs sit within sport management, business, or data science departments as concentrations or certificates.
| School | Degree Level | Format | Approx Duration | Approx Cost |
|---|---|---|---|---|
| University of Mississippi | Master’s | Online | 1 year, 30 credits | Around $14,000 total |
| Arizona State University | Bachelor’s (concentration) | Online | 4 years, 120 credits | Varies by credit hour |
| Michigan State University | Graduate Certificate | Online | Under 1 year, 12 credits | Not publicly listed |
| Northwestern University | Master’s (concentration) | On campus | 33 credits | Around $45,700 total |
| Syracuse University | Master’s | Online | Varies by track | Varies by track |
No matter which path you choose, most programs share one goal: giving you the statistics and technology skills teams actually look for when hiring.
What Comes Next for Sports Analytics
The field is still changing fast. Wearable devices are getting smaller and more accurate, giving teams live data during games rather than only after.
Teams are also increasingly using advanced computer models to support in-game decisions, though human judgment still plays the final role.
At the same time, as teams collect more personal health data from players, questions about who owns that data and how it can be used are becoming more common.
Final Thoughts
Sports analytics has moved from a niche tool to a normal part of how teams, coaches, and fans understand the game.
Knowing the basics gives you a clearer view of how modern sports actually operate, no matter which side of the field you are watching from.
If this is a field you want to go deeper into, a sports analytics degree program is a solid next step, one that builds the exact skills teams are actively hiring for today.
This is a space worth keeping an eye on in the years ahead, whether the interest lies in the numbers themselves or in the games they help explain.
Frequently Asked Questions
What is the difference between sports analytics and sports science?
Sports analytics focuses on data to guide decisions. Sports science focuses on the physical side of performance.
Which sport uses analytics the most?
Baseball and basketball are often seen as the most data-heavy sports, though football, soccer, and hockey use it heavily too.
Do you need to know how to code for sports analytics?
Not always, but knowing Python or R gives you a strong advantage for analyst and data scientist roles.