

Key Findings
|
|---|
Colorado breaks the pattern. No Deep South roots, no Appalachian poverty, yet 7th in the nation, the highest-risk state in the entire Mountain West. With 6,080 underweight newborns annually, it ranks third in volume among the top ten. If fear of enforcement is keeping immigrant mothers from prenatal care, Colorado’s numbers suggest the cost is already being paid.
The study conducted by Birth Injury Lawyers Group analyzed CDC WONDER Natality data from 2022 to 2024. Low birth weight rates were calculated per 1,000 live births for all 50 states, with Colorado analyzed individually for state-level risk assessment.
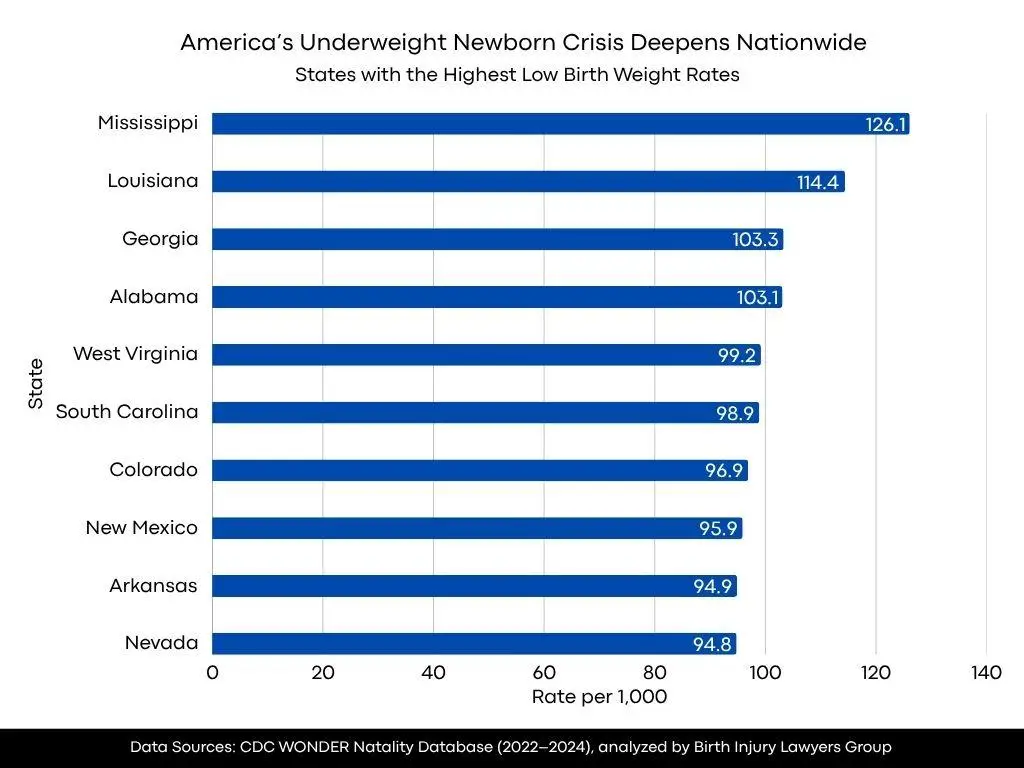
Colorado in National Context: Top 10 Highest-Risk States
| Rank | State | Rate per 1,000 | Annual LBW Deliveries |
|---|---|---|---|
| 1 | Mississippi | 126.1 | 4,313 |
| 2 | Louisiana | 114.4 | 6,283 |
| 3 | Georgia | 103.3 | 13,008 |
| 4 | Alabama | 103.1 | 5,978 |
| 5 | West Virginia | 99.2 | 1,672 |
| 6 | South Carolina | 98.9 | 5,747 |
| 7 | Colorado | 96.9 | 6,080 |
| 8 | New Mexico | 95.9 | 2,042 |
| 9 | Arkansas | 94.9 | 3,357 |
| 10 | Nevada | 94.8 | 3,077 |
Colorado ranks 7th nationally, one of only three non-Southern states in the top ten, yet recording the third highest LBW volume among them. With 6,080 underweight deliveries annually, it outpaces states with larger birth populations. Forty-three states do better. Colorado’s crisis isn’t a Southern inheritance, which makes it harder to explain, and harder to excuse.
Colorado: 7th Highest-Risk State in America
| Metric | Colorado | National Average / Benchmark |
|---|---|---|
| LBW Rate per 1,000 Live Births | 96.9 | 85.6 (National Avg.) |
| National Rank | 7th (7th Highest Risk) | N/A |
| Annual LBW Deliveries | 6,080 | 5,156 (Top 10 Avg.) |
| Annual Live Births | 62,715 | 3,623,041 (U.S. Total) |
| Gap vs. Safest State (NH, 67.2) | +29.8 per 1,000 (44% higher) | New Hampshire: 67.2 |
| Gap vs. National Average | +11.3 per 1,000 (13% above avg.) | 85.6 per 1,000 |
Colorado’s 96.9 per 1,000 sits 13% above the national average and 44% above the safest state, a number that challenges the state’s progressive health reputation. With 6,080 underweight newborns annually, Colorado ranks third in volume among the top ten, a burden that demands explanation beyond geography.
Colorado vs. Mountain West Peers

| State | LBW Rate per 1,000 | National Rank |
|---|---|---|
| Colorado | 96.9 | 7th |
| New Mexico | 95.9 | 8th |
| Nevada | 94.8 | 10th |
| Wyoming | 94.0 | 11th |
| Arizona | 79.0 | 32nd |
| Montana | 76.4 | 38th |
| Utah | 74.0 | 40th |
| Idaho | 70.1 | 47th |
| Mountain West Avg. (8 States) | 84.8 | Varied |
Among Mountain West states, which average 84.8 low birth weight deliveries per 1,000 live births, Colorado stands 14% above even this regional benchmark and leads all eight Mountain West states by rate. New Mexico ranks second in the region at 95.9 per 1,000, but Colorado’s 96.9 outpaces it by a full 1.0 point, and four Mountain West states sit below the national average entirely. Colorado’s dominance within its own region, combined with its national top-10 ranking, makes it an outlier that demands specific attention rather than regional generalization.
Colorado vs. America’s Safest States
| State | LBW Rate per 1,000 | National Rank |
|---|---|---|
| Colorado (7th Highest Risk) | 96.9 | 7th |
| New Hampshire (Safest) | 67.2 | 50th |
| Alaska | 68.5 | 49th |
| Washington | 69.5 | 48th |
| Idaho | 70.1 | 47th |
| Oregon | 70.8 | 46th |
| North Dakota | 70.9 | 45th |
| South Dakota | 71.8 | 44th |
| Minnesota | 72.9 | 43rd |
| Vermont | 73.1 | 42nd |
| Iowa | 73.6 | 41st |
| Safe-State Average (Bottom 10) | 70.8 | 41st to 50th |
The safest states average 70.8, Colorado is 37% above them. For a high-income state with a large immigrant population, 1 in every 10.3 births arriving underweight points to something beyond economics: cost, language, and fear may be keeping mothers from the care that neighboring states have made routine.
Colorado at a Glance: Summary Statistics
| Metric | Value |
|---|---|
| Colorado LBW Rate per 1,000 Live Births | 96.9 |
| Colorado National Rank | 7th (7th Highest in the U.S.) |
| Annual LBW Deliveries in Colorado | 6,080 |
| Annual Live Births in Colorado | 62,715 |
| Gap Above National Average (85.6) | 13% above national average |
| Gap vs. Safest State (New Hampshire) | 44% higher than New Hampshire |
| Mountain West Regional Average | 84.8 per 1,000 |
| Colorado vs. Mountain West Average | 14% above Mountain West avg. |
Every benchmark surprises: 7th nationally, 13% above average, 44% above the safest state, 14% above its own regional peers. One in every 10.3 Colorado babies born underweight, in a state that shouldn’t rank here. Geography and poverty don’t fully explain it, which means the possibility that enforcement fear is eroding prenatal care among immigrant communities is one Colorado’s public health leaders can no longer set aside.
Methodology
Data sourced from the CDC WONDER Natality Database using three-year averages (2022 to 2024) for reliable Colorado-specific estimates. Low birth weight is defined as under 2,500 grams (5.5 pounds) per CDC and WHO standards, with rates expressed per 1,000 live births. Colorado figures reflect state-level tabulation only. Regional and national averages are included for benchmarking. Rankings cover all 50 states (1 = highest risk). This analysis does not establish causation; maternal age, socioeconomic status, prenatal care access, and demographic factors may contribute to observed disparities.
Data Sources
Average annual live births 2022-2024: http://wonder.cdc.gov/controller/saved/D149/D475F179
Average annual deliveries with low birth weight 2022-2024:
http://wonder.cdc.gov/controller/saved/D149/D475F178
Research Dataset: https://docs.google.com/spreadsheets/d/1L49_O9ys2HbAPKRSarFMPbuZKF-P-61_1XuKbWk6fa8/edit?gid=0#gid=0
Study by: https://www.birthinjurylawyer.com
About Birth Injury Lawyers Group
Birth Injury Lawyers Group is a national law firm providing legal representation to families affected by preventable birth injuries. The firm advocates for improved maternal and infant health outcomes through data-driven research, public awareness initiatives, and dedicated legal support for families navigating the aftermath of birth-related complications.