
New NHTSA Analysis: The Centennial State Reports 4.20 Brake Complaints Per 100,000 Vehicles, Mountain Driving May Be a Factor
| #7 National Rank |
4.20 Per 100K Vehicles |
219 Total Complaints |
7.5x Higher Than Lowest |
|---|
Key Findings
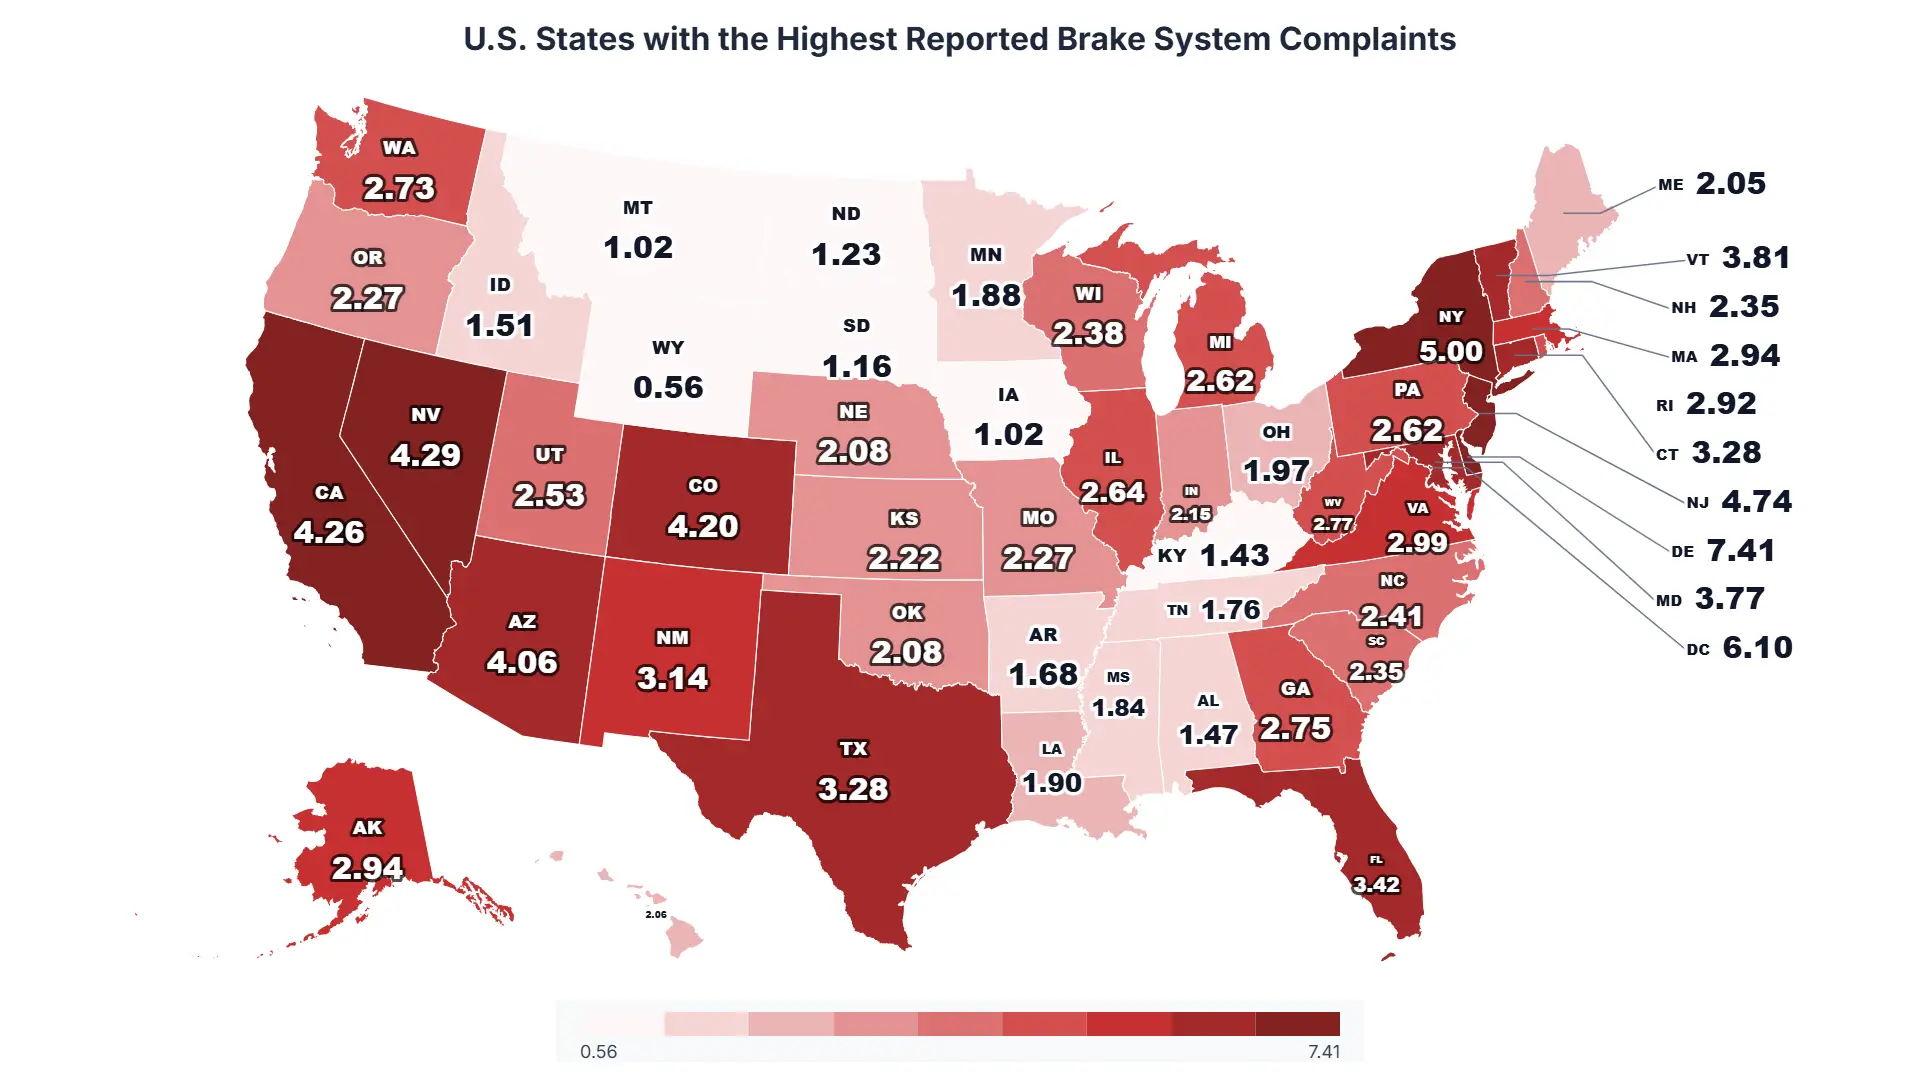
- Colorado ranks #7 nationally with 4.20 brake-related complaints per 100,000 registered vehicles, according to NHTSA Office of Defects Investigation data normalized by FHWA vehicle registrations.
- The Centennial State is the highest-ranked interior Mountain West state, trailing only coastal/urban-heavy jurisdictions like Delaware, D.C., New York, New Jersey, Nevada, and California.
- Colorado’s rate is 7.5 times higher than Wyoming (0.56), its neighbor to the north, and 66% higher than Utah (2.53) to the west, suggesting mountain terrain and Denver metro congestion may play significant roles.
- With 219 brake complaints against 5.2 million registered vehicles, Colorado’s elevated rate reflects the unique demands of driving in a state defined by steep grades, high altitude, and rapidly growing urban traffic.
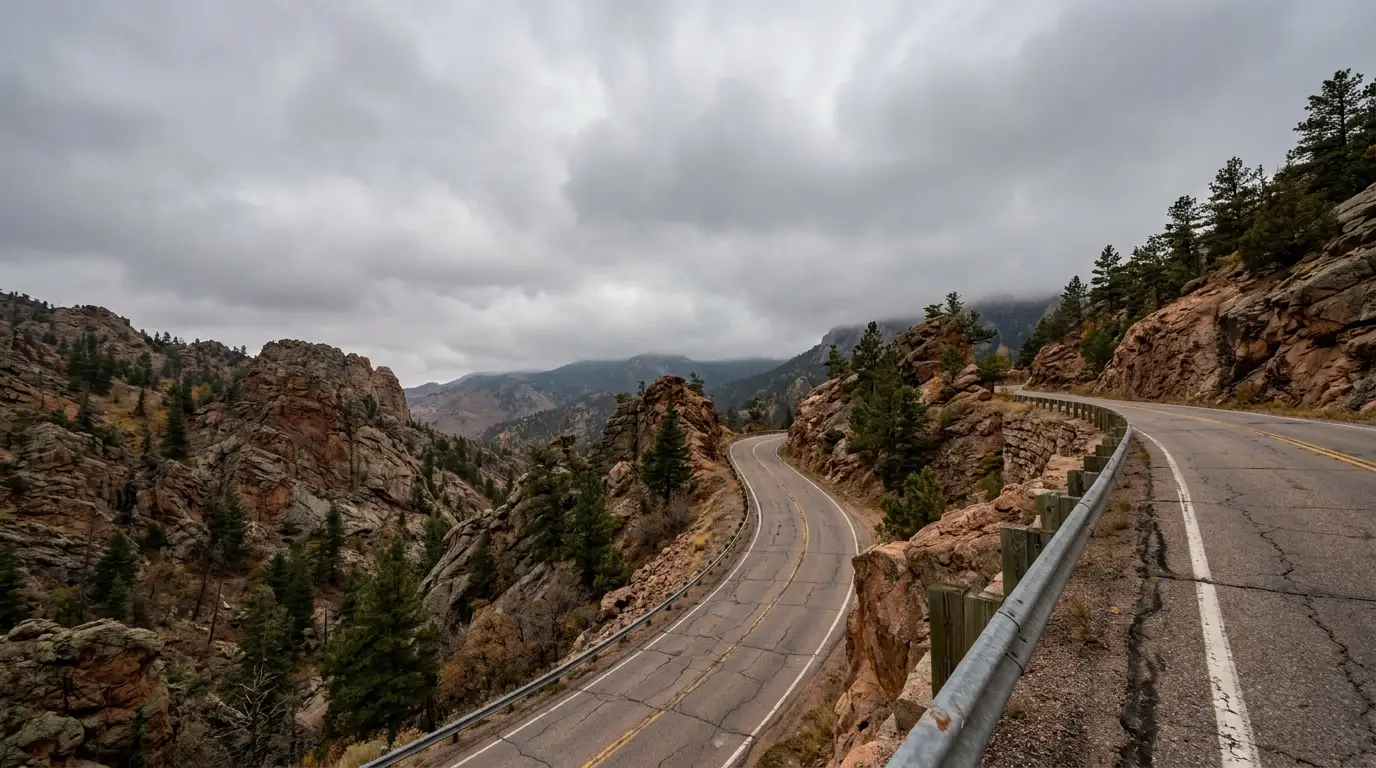
In a state where drivers routinely navigate 11,000-foot mountain passes and I-70 ski traffic, federal data reveals that Coloradans report brake problems at the seventh-highest rate in the country. The finding puts a spotlight on how the Centennial State’s unique terrain and growing population may impact vehicle safety.
A new analysis by Beck & Beck, Missouri Car Accident Lawyers, mapped NHTSA brake complaints across all 50 states and D.C., normalizing raw complaint counts by registered vehicle totals from the Federal Highway Administration. The result: Colorado’s complaint rate of 4.20 per 100,000 vehicles places it at #7 nationally, the highest among landlocked states.
Colorado Ranks #7 for Brake Complaints
| Rank | State | Complaints | Registered Vehicles | Per 100K |
|---|---|---|---|---|
| 1 | Delaware | 33 | 445,240 | 7.41 |
| 2 | District of Columbia | 21 | 344,088 | 6.10 |
| 3 | New York | 468 | 9,361,933 | 5.00 |
| 4 | New Jersey | 284 | 5,991,811 | 4.74 |
| 5 | Nevada | 115 | 2,681,539 | 4.29 |
| 6 | California | 1,322 | 31,057,329 | 4.26 |
| 7 | Colorado | 219 | 5,211,580 | 4.20 |
| 8 | Arizona | 262 | 6,447,062 | 4.06 |
| 9 | Vermont | 24 | 629,430 | 3.81 |
| 10 | Maryland | 186 | 4,935,108 | 3.77 |
What the data shows: Colorado’s #7 ranking places it in elite company, ahead of Arizona, Florida, Texas, and 42 other states. Notably, the six states ahead of Colorado are all either small, dense East Coast jurisdictions (Delaware, D.C., New Jersey) or coastal states with major urban centers (New York, Nevada, California). Colorado is the first true interior Mountain West state on the list.
Expert Commentary
“Colorado’s #7 ranking for brake complaints tells an important story about driving in the Centennial State. From the steep grades of I-70 through the Eisenhower Tunnel to stop-and-go traffic on the Denver Tech Center, Colorado drivers put extraordinary demands on their braking systems. This data should remind every Colorado driver, especially those heading to the mountains, to take brake maintenance seriously.”
— John Beck, Attorney & Founding Partner, Beck & Beck
Regional Comparison: Colorado vs. Mountain West States
| Rank | State | Complaints | Registered Vehicles | Per 100K |
|---|---|---|---|---|
| 5 | Nevada | 115 | 2,681,539 | 4.29 |
| 7 | Colorado | 219 | 5,211,580 | 4.20 |
| 8 | Arizona | 262 | 6,447,062 | 4.06 |
| 14 | New Mexico | 60 | 1,909,072 | 3.14 |
| 25 | Utah | 78 | 3,084,536 | 2.53 |
| 44 | Idaho | 31 | 2,057,655 | 1.51 |
| 50 | Montana | 24 | 2,357,075 | 1.02 |
| 51 | Wyoming | 5 | 890,622 | 0.56 |
Mountain West insight: Colorado ranks #2 among Mountain West states, trailing only Nevada (4.29). But Nevada’s rate is heavily influenced by Las Vegas traffic; Colorado’s elevated rate exists despite having no gambling-tourism traffic concentration. Colorado’s rate is 66% higher than Utah (2.53), 179% higher than Idaho (1.51), and a striking 7.5x higher than Wyoming (0.56). The contrast with Wyoming, a state that shares Colorado’s mountainous terrain but has far less urban density, suggests that the Denver metro’s growth may be a key driver.
Colorado vs. Neighboring States
| Rank | State | Complaints | Per 100K | Comparison to CO |
|---|---|---|---|---|
| 7 | Colorado | 219 | 4.20 | — |
| 8 | Arizona | 262 | 4.06 | CO 3% higher |
| 14 | New Mexico | 60 | 3.14 | CO 34% higher |
| 25 | Utah | 78 | 2.53 | CO 66% higher |
| 32 | Kansas | 55 | 2.22 | CO 89% higher |
| 34 | Oklahoma | 41 | 2.08 | CO 102% higher |
| 35 | Nebraska | 71 | 2.08 | CO 102% higher |
| 51 | Wyoming | 5 | 0.56 | CO 649% higher |
Neighbor comparison: Colorado’s brake complaint rate exceeds every neighboring state. The gap is modest with Arizona (3% higher) but dramatic with the Great Plains neighbors: 89% higher than Kansas, 102% higher than Nebraska, and a stunning 649% higher than Wyoming. This pattern suggests that Colorado’s unique combination of mountain terrain AND urban density creates brake stress that neither flat states (Kansas, Nebraska) nor rural mountain states (Wyoming) experience.
Raw Complaint Volume: Where Colorado Fits
| Rank | State | Complaints | Registered Vehicles |
|---|---|---|---|
| 1 | California | 1,322 | 31,057,329 |
| 2 | Texas | 769 | 23,477,492 |
| 3 | Florida | 667 | 19,519,552 |
| 4 | New York | 468 | 9,361,933 |
| 5 | Pennsylvania | 285 | 10,866,252 |
| … | … | … | … |
| 13 | Colorado | 219 | 5,211,580 |
Volume vs. Rate: By raw complaint count, Colorado ranks #13 nationally with 219 complaints. But when normalized for its 5.2 million registered vehicles, Colorado jumps to #7 in the per-capita ranking, a 6-position improvement that reflects the state’s moderately-sized but highly affected vehicle population. Colorado files more complaints per vehicle than states with 2-3x its vehicle count, including Florida (#11), Texas (#13 by rate), and Pennsylvania (#24).
U.S. States Ranked by Brake Complaints
| Rank | State | Complaints | Per 100K |
|---|---|---|---|
| 1 | Delaware | 33 | 7.41 |
| 2 | District of Columbia | 21 | 6.10 |
| 3 | New York | 468 | 5.00 |
| 4 | New Jersey | 284 | 4.74 |
| 5 | Nevada | 115 | 4.29 |
| 6 | California | 1,322 | 4.26 |
| 7 | Colorado | 219 | 4.20 |
| 8 | Arizona | 262 | 4.06 |
| 9 | Vermont | 24 | 3.81 |
| 10 | Maryland | 186 | 3.77 |
| 11 | Florida | 667 | 3.42 |
| 12 | Connecticut | 93 | 3.28 |
| 13 | Texas | 769 | 3.28 |
| 14 | New Mexico | 60 | 3.14 |
| 15 | Virginia | 237 | 2.99 |
| 16 | Massachusetts | 154 | 2.94 |
| 17 | Alaska | 20 | 2.94 |
| 18 | Rhode Island | 24 | 2.92 |
| 19 | West Virginia | 42 | 2.77 |
| 20 | Georgia | 253 | 2.75 |
| 21 | Washington | 203 | 2.73 |
| 22 | Illinois | 268 | 2.64 |
| 23 | Michigan | 260 | 2.62 |
| 24 | Pennsylvania | 285 | 2.62 |
| 25 | Utah | 78 | 2.53 |
| 26 | North Carolina | 211 | 2.41 |
| Rank | State | Complaints | Per 100K |
|---|---|---|---|
| 27 | Wisconsin | 138 | 2.38 |
| 28 | New Hampshire | 33 | 2.35 |
| 29 | South Carolina | 124 | 2.35 |
| 30 | Missouri | 125 | 2.27 |
| 31 | Oregon | 96 | 2.27 |
| 32 | Kansas | 55 | 2.22 |
| 33 | Indiana | 124 | 2.15 |
| 34 | Oklahoma | 71 | 2.08 |
| 35 | Nebraska | 41 | 2.08 |
| 36 | Hawaii | 26 | 2.06 |
| 37 | Maine | 28 | 2.05 |
| 38 | Ohio | 221 | 1.97 |
| 39 | Louisiana | 86 | 1.90 |
| 40 | Minnesota | 110 | 1.88 |
| 41 | Mississippi | 41 | 1.84 |
| 42 | Tennessee | 122 | 1.76 |
| 43 | Arkansas | 56 | 1.68 |
| 44 | Idaho | 31 | 1.51 |
| 45 | Alabama | 80 | 1.47 |
| 46 | Kentucky | 65 | 1.43 |
| 47 | North Dakota | 13 | 1.23 |
| 48 | South Dakota | 16 | 1.16 |
| 49 | Iowa | 39 | 1.02 |
| 50 | Montana | 24 | 1.02 |
| 51 | Wyoming | 5 | 0.56 |
Study Overview: By the Numbers
| Metric | Value |
|---|---|
| Total States Ranked | 51 (including D.C.) |
| Total Brake Complaints Analyzed | 8,328 |
| Colorado’s National Rank | #7 (overall) / #2 (Mountain West) |
| Colorado Complaints | 219 |
| Colorado Registered Vehicles | 5,211,580 |
| Colorado Rate (Per 100K) | 4.20 |
| National Highest Rate | 7.41 (Delaware) |
| National Lowest Rate | 0.56 (Wyoming) |
| CO vs. Wyoming Spread | 7.5x higher |
Methodology
In this five-year analysis (2021–2025), Beck & Beck compiled brake-related complaints from the National Highway Traffic Safety Administration’s (NHTSA) Office of Defects Investigation (ODI) public complaint database. The dataset was filtered to include records where the component field referenced “SERVICE BRAKES” and related brake system components.
Each state’s complaint total was then normalized using registered vehicle counts from the Federal Highway Administration’s (FHWA) Highway Statistics tables, producing a standardized rate of brake complaints per 100,000 registered vehicles. States were ranked from highest to lowest based on this per-vehicle complaint rate to allow meaningful comparisons across jurisdictions of varying size.
Data Sources
NHTSA ODI Complaints Database: https://www.nhtsa.gov/nhtsa-datasets-and-apis
FHWA Highway Statistics: https://www.fhwa.dot.gov/policyinformation/statistics.cfm
Research Dataset: https://docs.google.com/spreadsheets/d/1TuPMdazTPyt1txGzcI-2jwMEs4_PtTcA/edit?gid=577319361#gid=577319361
Study by: https://becklawmo.com/
About Beck & Beck
Beck & Beck, Missouri Car Accident Lawyers, is an experienced law firm focused on vehicle accident representation. The firm supports clients from early claim evaluation through medical care coordination and insurance negotiations, advocating aggressively for fair outcomes after serious crashes. For more information or media inquiries related to this report, contact our team.